
October 12th 2026, 12:00 PM
Bitcoin Repeats Historic Pattern, Will It Rally or Rebound
Key Summary
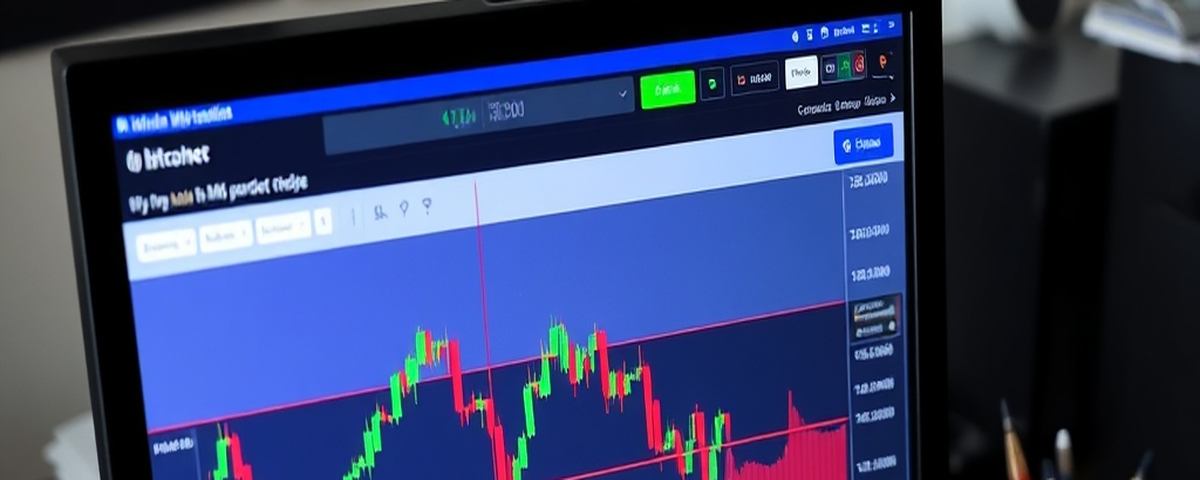
Bitcoin has closed above its 50-week average for four straight weeks, a rare pattern that has only appeared twice before, triggering dramatic moves in opposite directions. The last time it occurred, Bitcoin surged 217% in 2023 but crashed 50% after an initial 170% gain in 2019. The current streak mirrors the 2023 signal, which was a success story, but analysts attribute differences to speculative factors like liquidity and halving events. The 50-week average is changing weekly, and a fourth consecutive close above the average suggests buyers are dominating the market.
Please see our real time news feed on our Home Page
Market Overview
The S&P 500, Dow Jones, Nasdaq 100, and Russell 2000 indices closed at 7,822.80, 51,778.30, 30,849.90, and 2,807.53, respectively, with the S&P 500 experiencing a slight decrease of 0.01%.Bitcoin's 50-Week Average
Bitcoin has closed above its 50-week average for four straight weeks, trading at $83,369 as of October 12, 2026. The last two times this signal triggered, Bitcoin surged 217% in 2023 but crashed 50% after an initial 170% gain in 2019. A weekly close below $76,618 would end the streak and signal a return to a downtrend, making each week's close critical to watch.Historical Context
The 50-week average is calculated by averaging Bitcoin's closing prices for the past 50 weeks. It helps smooth out price fluctuations, giving a clearer picture of longer-term trends. When Bitcoin stays above this average, it indicates that buyers are dominating the market. If it trades below, it suggests sellers are in control.Speculation and Analysis
Analysts attribute the differences in outcomes between the 2019 and 2023 signals to factors like liquidity, the amount of money flowing into riskier investments, and the timing of halving events, when the rate of new Bitcoin production is reduced. However, with only two instances to reference, these explanations remain speculative. Bitcoin is currently about 33.9% below its record high of $126,080. It has risen 8.0% over the past 30 days but fallen 3.2% in the last week. This mix of trends could indicate a scenario similar to either of the previous signals.Changing Average
The 50-week average is always changing. Each week, the oldest closing price drops out of the calculation while the most recent price is included, slightly altering the average Bitcoin needs to maintain. This four-week streak strongly suggests Bitcoin's trend may be shifting upward. However, it doesn't necessarily indicate how far the price will rise or fall.#Bitcoin#US#Crypto#SEC